
November is here, and with it the busiest stretch of the retail year: Singles’ Day, Black Friday, Cyber Monday. Red price tags on the shelves, discount codes in every inbox, countdowns all over social media. And at the end of the month, the same slide lands on the meeting table: “Revenue grew 40% during the campaign.”
But how much of that growth was really caused by the discount? How much did we give away on products customers would have bought anyway? Why were sales flat for weeks after the campaign ended? And most importantly: did the campaign generate profit, or just revenue?
The answers are not in campaign revenue. They are in the incremental impact. In this article we walk through 5 steps to measuring campaign impact with data, which you can put in place before the season is over.
Why is campaign revenue a misleading metric?
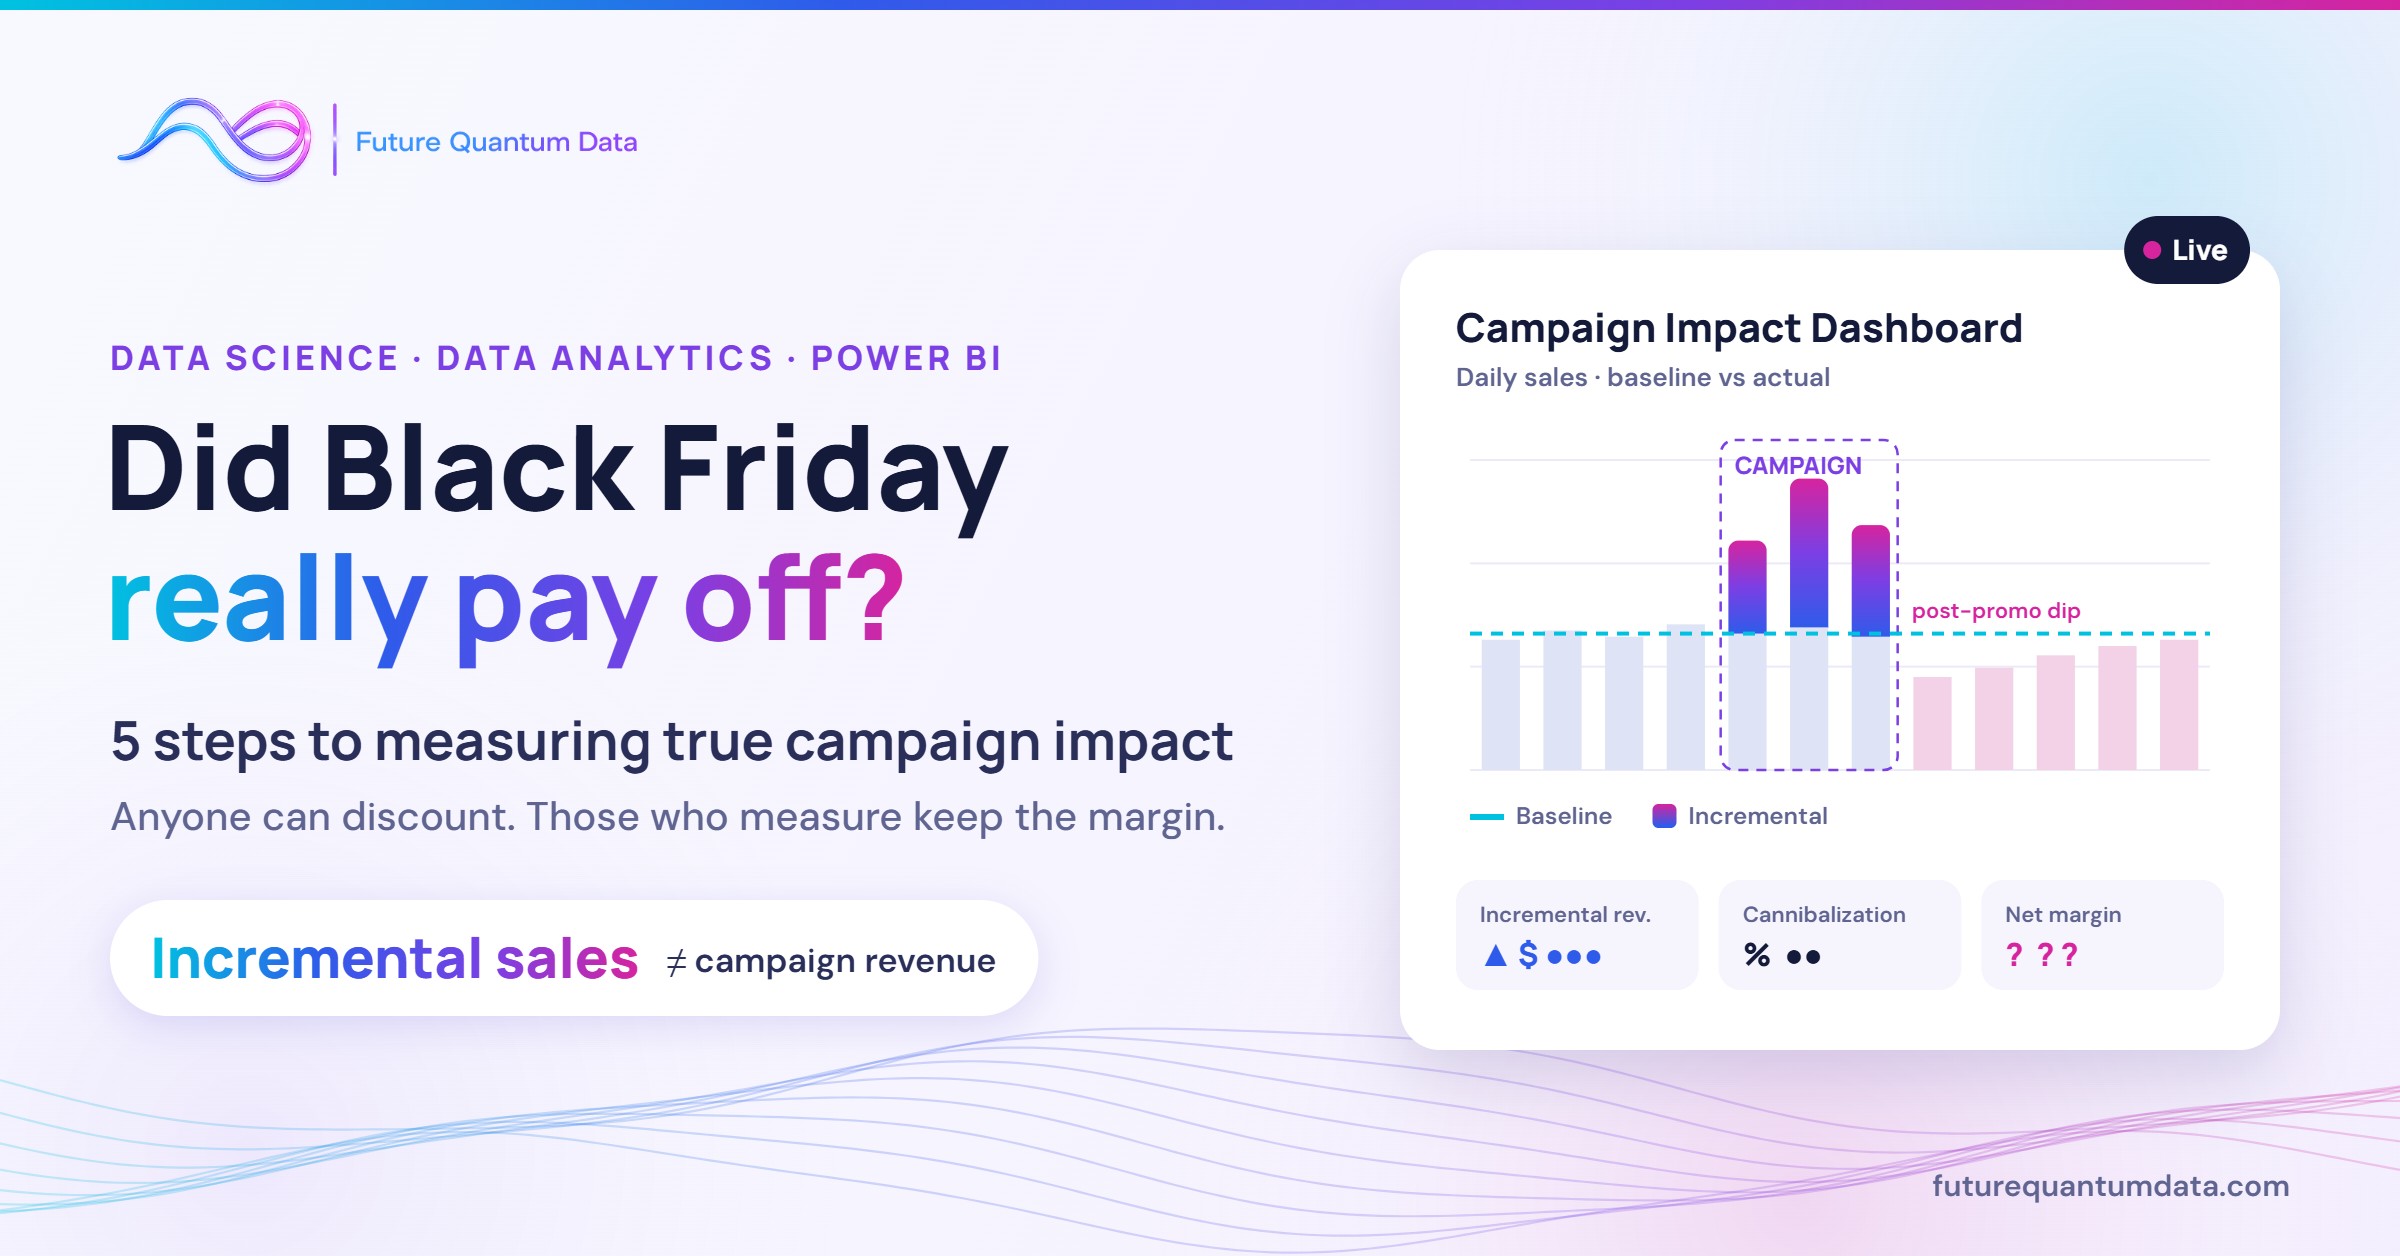
Every sale that goes through the till during a campaign looks like campaign success. Yet that number also includes sales that would have happened without any promotion. To see the real picture, you need to separate four effects:
- Baseline sales: what you would have sold without the discount.
- Incremental sales: the extra sales that came only because of the campaign. This is the campaign’s real contribution.
- Cannibalization: the discounted product stealing sales from full-price products in the same category.
- Pull-forward (post-promo dip): customers shifting purchases they would have made anyway into the campaign window, so sales fall below baseline in the weeks after.
A revenue chart stacks all four into one bar. To make decisions, you need to see them separately.
5 steps to measuring campaign impact
1. Forecast baseline sales before the campaign
Everything starts with one question: what would we have sold without the discount? A forecasting model that uses historical sales, seasonality, day-of-week effects, paydays and holidays produces a baseline for the campaign period. When the campaign ends, you compare actual sales against that line. We explain how to set this up in How to Build Demand Forecasting in Retail.
2. Set up a control group where you can
The most reliable way to measure is comparison. Similar stores, regions or customer segments where the campaign did not run form a control group. The difference between the campaign and non-campaign groups shows incremental impact without relying on forecasts alone. Even for chain-wide campaigns, comparable products left out of the promotion can serve as a reference.
3. Measure discount depth and price response
Going from a 20% to a 40% discount rarely doubles the sales lift. For some products a small discount drives a clear jump in demand; for others even a deep discount brings only a handful of extra units. Mapping the relationship between discount rate and sales lift from past campaigns, by product and category, keeps you from giving away margin for nothing next time.
4. Account for cannibalization and the post-promo dip
If the discounted product sold more but the rest of the category sold less, do not declare success before looking at the category total. Likewise, keep watching the 2-4 weeks after the campaign: if sales drop below baseline, the campaign did not create new demand, it pulled existing demand forward. The true incremental impact is the extra sales during the campaign minus these two losses.
5. Report the result in net margin, not revenue
The final step is tying all of these effects to a single financial outcome: incremental gross profit. Once you account for the discount given, campaign marketing and advertising costs, extra logistics and staffing, and the cost of overstock or stockouts, it becomes clear whether the campaign really paid off. It can be surprising to find that the campaign with the highest revenue left the lowest profit.
During the campaign: a live Power BI dashboard
Measurement should not be just a report produced after the campaign ends. A dashboard tracked hourly and daily while the campaign runs lets you act along the way:
- Actual sales vs. baseline forecast and target
- Stock levels and stockout risk by product and category
- Performance by channel (stores, e-commerce, app)
- Margin and profit contribution by discount level
If a product is selling far above expectations, stock can be redirected; a discount that is not getting the expected response can be reviewed early. A well-designed dashboard turns the campaign from “we’ll see when it’s over” into a process you can actually manage.
A short checklist for campaign analytics
- Did you forecast baseline sales before the campaign?
- Is there a control group or reference product set for comparison?
- Were discount levels set per product, based on past response?
- Are you tracking category totals and cannibalization?
- Is the 2-4 week post-campaign period included in reporting?
- Is success measured in revenue, or in incremental net margin?
If you answered “no” to most of these, you are not alone. The good news is that this season’s data is the most valuable starting point for building that capability.
How Future Quantum Data can help
- Data Consulting: we define together which metrics will measure campaign success and what data you need.
- Data Science: we build baseline forecasting, price response and incremental impact models.
- Data Analytics: we bring sales, stock, campaign and cost data into a single trusted structure.
- Power BI: we design dashboards for live monitoring during campaigns and impact analysis afterwards.
If you want to turn this year’s campaigns into next year’s profitable decisions, get in touch with us or write to [email protected].